6 files added
5 files modified
| | |
|---|
| | | .t_bg_b{width: 100%;height: 485.35px; background:url(./images/bg2.png) no-repeat center top;background-size: 100%;}
|
|---|
| | | .t_bg_b h1{padding-top: 25px; text-align: center; font-size: 16px; line-height: 34px; font-weight: 600;}
|
|---|
| | |
|
|---|
| | |
|
|---|
| | | .table_bg{ margin: 0 85px;}
|
|---|
| | | |
|---|
| | | .table_t{}
|
|---|
| | | .table_t .t01,.table_t .t02,.table_t .t03,.table_t .t04{ float: right;text-align:center;font-size: 12px;color: #00f6ff; font-weight: bold;}
|
|---|
| | | .table_t .t01{ width: 125px;}
|
|---|
| | | .table_t .t02{ width: 115px;}
|
|---|
| | | .table_t .t03{ width: 260px;}
|
|---|
| | | .table_t .t04{ width: 280px;}
|
|---|
| | | |
|---|
| | | .table_text{ margin: 5px 0;}
|
|---|
| | | .table_text img{ }
|
|---|
| | | .table_text .table_tab_bg{background: url(./images/table_bg.png) no-repeat right;}
|
|---|
| | | .table_text .tab1,.table_text .tab2,.table_text .tab3,.table_text .tab4{ float: left; color: #fff; text-align: center; margin-top: 4px;}
|
|---|
| | | .table_text .tab1{ width: 125px; font-size: 11px; padding: 0 10px;}
|
|---|
| | | .table_text .tab2{ width: 115px; font-size: 10px; padding: 0 10px; line-height: 15px;}
|
|---|
| | | .table_text .tab3{ width: 260px; font-size: 10px; padding: 0 25px; line-height: 15px;}
|
|---|
| | | .table_text .tab4{ width: 280px; font-size: 10px; padding: 0 20px; line-height: 15px;}
|
|---|
| | |
|
|---|
| | |
|---|
| | | <div id="pieChar" style="height: 485.35px; width: 1000px"></div>
|
|---|
| | | </div>
|
|---|
| | |
|
|---|
| | | <div class="bg" *ngIf="!spinning">
|
|---|
| | | <div class="t_bg_b">
|
|---|
| | | <div id="conclusion" class="bg" *ngIf="!spinning && isShow" >
|
|---|
| | | <div class="t_bg_b">
|
|---|
| | | <h1>{{title}}数据报表总结分析</h1>
|
|---|
| | | <div class="table_bg">
|
|---|
| | | <div class="table_t">
|
|---|
| | | <p class="t04">建议采取的措施</p>
|
|---|
| | | <p class="t03">健康影响</p>
|
|---|
| | | <p class="t02">超标警报次数排行</p>
|
|---|
| | | <p class="t01">污染物</p> |
|---|
| | | <div class="clear_fix"></div> |
|---|
| | | </div>
|
|---|
| | | <div class="table_text" *ngFor="let item of resultArr;let i = index">
|
|---|
| | | <img src="./assets/img/No{{i+1}}.png" style="float: left;">
|
|---|
| | | <div class="table_tab_bg">
|
|---|
| | | <p class="tab1">{{item.sensorName}}</p>
|
|---|
| | | <p class="tab2">{{item.monitorPointName}}({{item.result}})</p>
|
|---|
| | | <p class="tab3">{{item.effect}}</p>
|
|---|
| | | <p class="tab4">{{item.measures}}</p>
|
|---|
| | | <div class="clear_fix"></div>
|
|---|
| | | </div> |
|---|
| | | </div>
|
|---|
| | | </div>
|
|---|
| | | </div>
|
|---|
| | | </div>
|
|---|
| | |
|
|---|
| | |
|---|
| | | legend: { |
|---|
| | | data: [], |
|---|
| | | orient: 'vertical', |
|---|
| | | right: 40, |
|---|
| | | right: 30, |
|---|
| | | top: 5, |
|---|
| | | bottom: 20, |
|---|
| | | type: 'scroll' |
|---|
| | |
|---|
| | | }; |
|---|
| | | |
|---|
| | | public sensorArr: any = []; |
|---|
| | | public resultArr: any = []; |
|---|
| | | public items: any = []; |
|---|
| | | public title: string; |
|---|
| | | private timeArr = ['年', '月', '日', '时', '分']; |
|---|
| | | public typeArr = ['year', 'month', 'day', 'hour']; |
|---|
| | | public sensorKeys: any = [ |
|---|
| | | {key: 'e1', name: 'PM 2.5'}, |
|---|
| | | {key: 'e2', name: 'PM 10'}, |
|---|
| | | {key: 'e10', name: '一氧化碳(CO)'}, |
|---|
| | | {key: 'e11', name: '二氧化硫(SO₂)'}, |
|---|
| | | {key: 'e15', name: '臭氧(O₃)'}, |
|---|
| | | {key: 'e16', name: '二氧化氮(NO₂)'} |
|---|
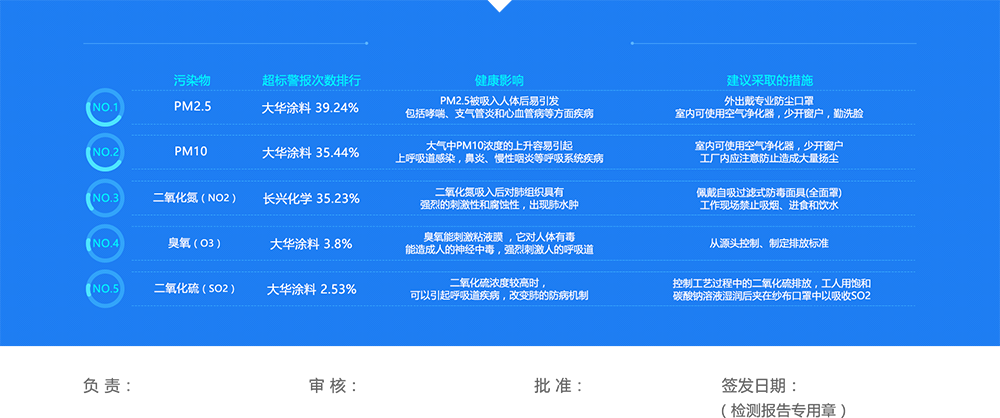
| | | {key: 'e1', name: 'PM 2.5', effect: 'PM2.5被吸入人体后易引发包括哮喘、支气管炎和心血管病等方面疾病', measures: '外出戴专业防尘口罩室内可使用空气净化器,少开窗户,勤洗脸'}, |
|---|
| | | {key: 'e2', name: 'PM 10', effect: '大气中PM10浓度上升易引起上呼吸道感染,鼻炎、慢性咽炎等呼吸系统疾病', measures: '室内可使用空气净化器,少开窗户工厂内应注意防止造成大量扬尘'}, |
|---|
| | | {key: 'e10', name: '一氧化碳(CO)', effect: '一氧化碳与血红蛋白的结合,抑制、延缓氧血红蛋白的解析和释放', measures: '制定和执行一氧化碳的卫生标准'}, |
|---|
| | | {key: 'e11', name: '二氧化硫(SO₂)', effect: '二氧化硫浓度较高时,可以引起呼吸道疾病,改变肺的防病机制', measures: '控制工艺过程中的二氧化硫排放,工人用饱和碳酸钠溶液湿润后夹在纱布口罩中以吸收SO2'}, |
|---|
| | | {key: 'e15', name: '臭氧(O₃)', effect: '臭氧能刺激粘液膜 ,它对人体有毒能造成人的神经中毒,强烈刺激人的呼吸道', measures: '从源头控制、制定排放标准'}, |
|---|
| | | {key: 'e16', name: '二氧化氮(NO₂)', effect: '二氧化氮吸入后对肺组织具有强烈的刺激性和腐蚀性,出现肺水肿', measures: '佩戴自吸过滤式防毒面具(全面罩)工作现场禁止吸烟、进食和饮水'} |
|---|
| | | ]; |
|---|
| | | |
|---|
| | | private pieCharOption: any = { |
|---|
| | |
|---|
| | | graphic: [], |
|---|
| | | series: [] |
|---|
| | | }; |
|---|
| | | |
|---|
| | | public isShow = true; |
|---|
| | | ngOnInit() { |
|---|
| | | const params = JSON.parse(sessionStorage.getItem('queryParams')); |
|---|
| | | if (!!params) { |
|---|
| | |
|---|
| | | option.yAxis.name = split[2] && split[2] !== 'null' ? '单位:' + split[2] : ''; |
|---|
| | | option.series = []; |
|---|
| | | option.legend.data = []; |
|---|
| | | if (index % 2 == 0) { |
|---|
| | | if (index % 2 === 0) { |
|---|
| | | option.backgroundColor = 'rgba(0,0,0,0)'; |
|---|
| | | } else { |
|---|
| | | option.backgroundColor = 'rgba(23,133,23,0.06)'; |
|---|
| | |
|---|
| | | this.title += title[i] + timeArr[i]; |
|---|
| | | } |
|---|
| | | |
|---|
| | | if ((params.type == 'month' || params.type == 'year') && res.data.sortList.length > 0) { |
|---|
| | | if ((params.type === 'month' || params.type === 'year') && res.data.sortList.length > 0) { |
|---|
| | | let center = ['50%', '50%']; |
|---|
| | | let left = '40%'; |
|---|
| | | const length = items.length; |
|---|
| | | const alarmDatas = res.data.alarmDatas; |
|---|
| | | for (let i = 0; i < length; i++) { |
|---|
| | | this.pieCharOption.legend.data = []; |
|---|
| | | let data = []; |
|---|
| | | const data = []; |
|---|
| | | this.sensorKeys.forEach(sensorKey => { |
|---|
| | | this.pieCharOption.legend.data.push(sensorKey.name); |
|---|
| | | if (alarmDatas[i]) { |
|---|
| | |
|---|
| | | }); |
|---|
| | | } |
|---|
| | | }); |
|---|
| | | if (length == 2) { |
|---|
| | | if (i == 0) { |
|---|
| | | if (length === 2) { |
|---|
| | | if (i === 0) { |
|---|
| | | center = ['25%', '50%']; |
|---|
| | | left = '15%'; |
|---|
| | | } else { |
|---|
| | |
|---|
| | | center: center, |
|---|
| | | label: { |
|---|
| | | normal: { |
|---|
| | | formatter: "{b}:{d}%" |
|---|
| | | formatter: '{b}:{d}%' |
|---|
| | | } |
|---|
| | | }, |
|---|
| | | labelLine: { |
|---|
| | |
|---|
| | | }); |
|---|
| | | } |
|---|
| | | |
|---|
| | | if (sensors.length % 2 == 0) { |
|---|
| | | if (sensors.length % 2 === 0) { |
|---|
| | | this.pieCharOption.backgroundColor = 'rgba(0,0,0,0)'; |
|---|
| | | } else { |
|---|
| | | this.pieCharOption.backgroundColor = 'rgba(23,133,23,0.06)'; |
|---|
| | | } |
|---|
| | | const myChart = echarts.init(document.getElementById('pieChar')); |
|---|
| | | myChart.setOption(this.pieCharOption, true); |
|---|
| | | window.onresize = myChart.resize; |
|---|
| | | const myChart = echarts.init(document.getElementById('pieChar')); |
|---|
| | | myChart.setOption(this.pieCharOption, true); |
|---|
| | | window.onresize = myChart.resize; |
|---|
| | | |
|---|
| | | for (let i = 0, j = res.data.sortList.length; i < j; i++) { |
|---|
| | | if (i < 5) { |
|---|
| | | for (const key in res.data.sortList[i]) { |
|---|
| | | const split = key.split('-'); |
|---|
| | | this.sensorKeys.forEach(sensor => { |
|---|
| | | if (sensor.key === split[0]) { |
|---|
| | | this.resultArr.push({ |
|---|
| | | sensorName: sensor.name, |
|---|
| | | monitorPointName: this.items[split[1]].mac ? this.items[split[1]].deviceName : this.items[split[1]].monitorPointName, |
|---|
| | | result: res.data.sortList[i][key] + '%', |
|---|
| | | effect: sensor.effect, |
|---|
| | | measures: sensor.measures |
|---|
| | | }); |
|---|
| | | } |
|---|
| | | |
|---|
| | | }); |
|---|
| | | } |
|---|
| | | } |
|---|
| | | } |
|---|
| | | } else { |
|---|
| | | $('#pieChar').remove(); |
|---|
| | | this.isShow = false; |
|---|
| | | } |
|---|
| | | } |
|---|
| | | }); |
|---|
| | |
|---|
| | | import {DateService} from "../../../business/services/util/date.service";
|
|---|
| | | import {HttpClient} from "@angular/common/http";
|
|---|
| | | import {DateService} from '../../../business/services/util/date.service';
|
|---|
| | | import {HttpClient} from '@angular/common/http';
|
|---|
| | | import {Component, OnInit} from '@angular/core';
|
|---|
| | | import {_HttpClient} from '@delon/theme';
|
|---|
| | | import {Subject} from "rxjs";
|
|---|
| | | // tslint:disable-next-line:import-blacklist
|
|---|
| | | import {Subject} from 'rxjs';
|
|---|
| | | import {CascaderOption} from 'ng-zorro-antd/src/cascader/nz-cascader.component';
|
|---|
| | | import {AreacodeService} from '@business/services/http/areacode.service';
|
|---|
| | | import {NzTreeComponent} from 'ng-tree-antd';
|
|---|
| | | import {NzMessageService} from "ng-zorro-antd";
|
|---|
| | | import {NzMessageService} from 'ng-zorro-antd';
|
|---|
| | | import {environment} from '../../../../environments/environment';
|
|---|
| | | import * as echarts from 'echarts';
|
|---|
| | | import * as $ from 'jquery';
|
|---|
| | |
|---|
| | | {value: 'sensor', label: '项目'},
|
|---|
| | | {value: 'monitorPoint', label: '监测点'}
|
|---|
| | | ];
|
|---|
| | | isDisable: boolean = false;
|
|---|
| | | isDisable = false;
|
|---|
| | | private treeClickStream: Subject<any> = new Subject<any>();
|
|---|
| | | private _sensors: {[key: string]: string} = {};
|
|---|
| | | private _sensorNames: string;
|
|---|
| | |
|---|
| | | },
|
|---|
| | | tooltip: {
|
|---|
| | | trigger: 'item',
|
|---|
| | | formatter: "{a} <br/>{b}: {c} ({d}%)"
|
|---|
| | | formatter: '{a} <br/>{b}: {c} ({d}%)'
|
|---|
| | | },
|
|---|
| | | // legend: {
|
|---|
| | | // //x : 'center',
|
|---|
| | |
|---|
| | | radius: ['20%', '40%'],
|
|---|
| | | label: {
|
|---|
| | | normal: {
|
|---|
| | | formatter: "{b}:{d}%"
|
|---|
| | | formatter: '{b}:{d}%'
|
|---|
| | | }
|
|---|
| | | },
|
|---|
| | | labelLine: {
|
|---|
| | |
|---|
| | | }
|
|---|
| | | },
|
|---|
| | | data: []
|
|---|
| | | }
|
|---|
| | | };
|
|---|
| | |
|
|---|
| | | ngOnInit() {
|
|---|
| | | this.http.get(environment.SERVER_BASH_URL + 'sensor/all').subscribe((res: any) => {
|
|---|
| | |
|---|
| | | }
|
|---|
| | |
|
|---|
| | | dimensionChange(value) {
|
|---|
| | | if (value == 'sensor') { |
|---|
| | | this.isDisable = false; |
|---|
| | | } else { |
|---|
| | | if (value === 'sensor') {
|
|---|
| | | this.isDisable = false;
|
|---|
| | | } else {
|
|---|
| | | this.isDisable = true;
|
|---|
| | | this.query.monitorPointId = null;
|
|---|
| | | this.query.mac = null;
|
|---|
| | |
|---|
| | | $('#mydiv').empty();
|
|---|
| | | for (let index = 0; index < 30; index++) {
|
|---|
| | | this.sensorArr.push(index);
|
|---|
| | | $('#mydiv').append("<div id='mydiv" + index + "' style='height: 485.35px; width: 1000px'></div>");
|
|---|
| | | $('#mydiv').append('<div id=\'mydiv' + index + '\' style=\'height: 485.35px; width: 1000px\'></div>');
|
|---|
| | | }
|
|---|
| | | this.loading = true;
|
|---|
| | | this.isShow = false;
|
|---|
| | |
|---|
| | | this.http.get(environment.SERVER_BASH_URL + 'report/pie', {params: query}).subscribe((res: any) => {
|
|---|
| | | const option = this.pieCharOption;
|
|---|
| | | let index = 0;
|
|---|
| | | if (query.dimension == 'monitorPoint') { |
|---|
| | | if (query.dimension === 'monitorPoint') {
|
|---|
| | | for (const key in res.data) {
|
|---|
| | | let name: string;
|
|---|
| | | this.sensorOptions[0].children.forEach(sensor => {
|
|---|
| | | if (key == sensor.sensorKey) {
|
|---|
| | | if (key === sensor.sensorKey) {
|
|---|
| | | name = sensor.name;
|
|---|
| | | }
|
|---|
| | | });
|
|---|
| | | option.title.text = name + '指标报警占比情况';
|
|---|
| | |
|
|---|
| | | if (index % 2 == 0) {
|
|---|
| | | if (index % 2 === 0) {
|
|---|
| | | option.backgroundColor = 'rgba(0,0,0,0)';
|
|---|
| | | } else {
|
|---|
| | | option.backgroundColor = 'rgba(23,133,23,0.06)';
|
|---|
| | |
|---|
| | | myChart.setOption(option, true);
|
|---|
| | | window.onresize = myChart.resize;
|
|---|
| | | index = index + 1;
|
|---|
| | | } |
|---|
| | | } else { |
|---|
| | | }
|
|---|
| | | } else {
|
|---|
| | | option.title.text = '指标报警占比情况';
|
|---|
| | | option.series = [];
|
|---|
| | | this.serie.data = res.data.list;
|
|---|
| | |
|---|
| | | window.onresize = myChart.resize;
|
|---|
| | | index = index + 1;
|
|---|
| | |
|
|---|
| | | //this.setOption(option,index); |
|---|
| | | // this.setOption(option,index);
|
|---|
| | | }
|
|---|
| | |
|
|---|
| | | this.sensorArr.forEach(i => {
|
|---|
| | |
|---|
| | | }
|
|---|
| | | }
|
|---|
| | |
|
|---|
| | | setOption(option,index) {
|
|---|
| | | setOption(option, index) {
|
|---|
| | | const myChart = echarts.init(document.getElementById('mydiv' + index));
|
|---|
| | | myChart.setOption(this.pieCharOption, true);
|
|---|
| | | window.onresize = myChart.resize;
|
|---|


